
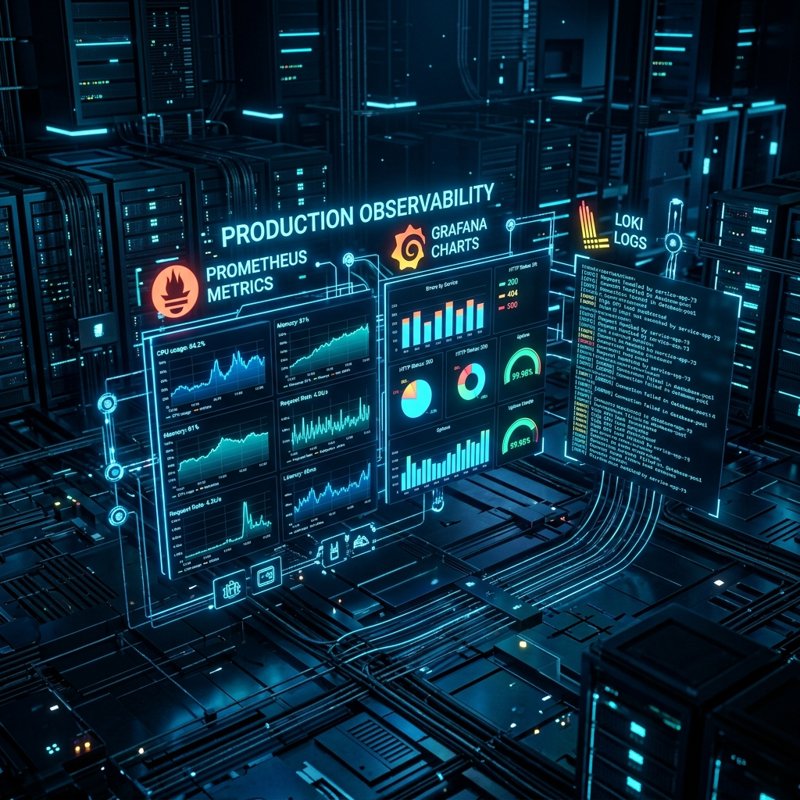
The 3 Pillars of Observability
Without centralized observability, debugging production incidents requires SSHing into worker nodes and tailing log files — costing hours of downtime.
- ▸Prometheus Metrics Scraping: Scraping cluster infrastructure, node exporter, and custom application metrics.
- ▸Loki Structured Logging: Centralized log aggregation indexed by Kubernetes labels without expensive full-text indexing overhead.
- ▸Grafana Alertmanager: Routing critical P0 alerts (pod crash loops, disk space >90%) directly to Slack and PagerDuty while suppressing non-actionable noise.